JVM Memory Areas
The Question
What are the different memory areas allocated by the JVM?
What a Strong Answer Covers
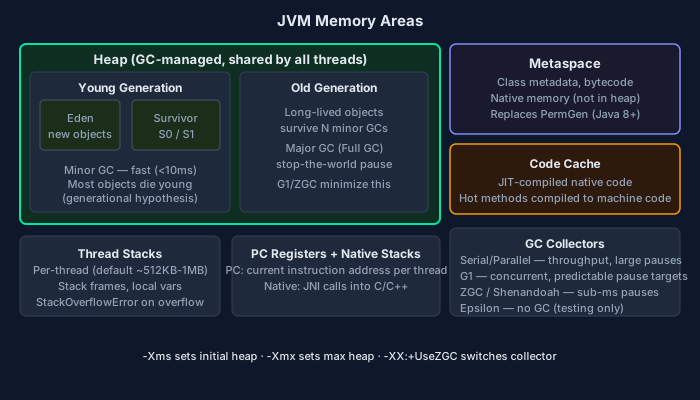
- Method Area/Metaspace = class data shared
- Heap = objects shared GC managed
- Stack = per-thread local variables
- PC Registers = per-thread current instruction
- Native Method Stack = native methods
Senior-Level Answer
The JVM divides memory into several runtime data areas, each with a specific purpose and lifecycle.
**Heap**: The largest memory area. All object instances and arrays are allocated here. It is shared across all threads and is managed by the garbage collector. The heap is further divided into Young Generation (Eden + two Survivor spaces) and Old Generation (Tenured), with G1GC and ZGC using region-based layouts instead. `OutOfMemoryError` is thrown when the heap is exhausted.
**Stack (JVM Stack)**: Each thread has its own stack. It stores stack frames — one per method invocation. A frame holds: local variables, the operand stack, and a reference to the runtime constant pool of the method's class. When a method returns, its frame is popped. `StackOverflowError` is thrown when recursion exhausts the stack depth.
**Method Area** (Metaspace in Java 8+): Stores class-level data: the runtime constant pool, field and method data, method bytecode, and static variables. Prior to Java 8 this was PermGen (fixed size, a common OOM source). Java 8 replaced it with Metaspace, which uses native memory and grows dynamically (bounded by `MaxMetaspaceSize`). Each class loaded by a classloader stores its metadata here.
**PC Register** (Program Counter): One per thread. Holds the address of the current JVM instruction being executed. For native methods, the PC is undefined.
**Native Method Stack**: Supports native (non-Java) methods written in C/C++ via JNI. One per thread. Behaves like the JVM stack but for native frames.
**Runtime Constant Pool**: Technically part of the Method Area. Contains symbolic references from the class file's constant pool, resolved at runtime to actual memory references.
For GC tuning, Heap sizing (`-Xms`, `-Xmx`) and Metaspace sizing (`-XX:MaxMetaspaceSize`) are the primary levers.
What Separates a 2/3 from a 3/3
2/3 — Passing but Incomplete
Correctly describes Heap, Stack, and Method Area/Metaspace with their purposes and per-thread vs shared characteristics.
3/3 — Strong Answer
Also covers PC Register, Native Method Stack, the PermGen-to-Metaspace migration in Java 8, heap generations, and relevant JVM flags.
Common Mistakes
- Saying PermGen still exists in Java 8+ — it was replaced by Metaspace which uses native memory.
- Thinking the heap is per-thread — only the JVM Stack and PC Register are thread-local; the heap is shared.
- Conflating the Method Area with the Heap — class metadata lives in Metaspace, not the GC-managed heap.
Follow-Up Questions
- Why did Java 8 replace PermGen with Metaspace, and what operational problem did this solve? — PermGen had a fixed maximum size, causing OutOfMemoryError on heavy class loading. Metaspace uses native memory and grows dynamically.
- What data lives on the stack frame that is NOT in the heap? — Local variable values (primitives or references), operand stack for instruction execution, and the frame's constant pool reference.
- What triggers OutOfMemoryError vs StackOverflowError? — OOM: heap or Metaspace exhausted. SOE: stack depth limit exceeded, typically from unbounded recursion.
Related Questions
Can You Explain This Cold?
Reading the answer is step one. Explaining it unprompted — under interview pressure — is what actually matters. Get AI-graded feedback on your answer with follow-up probes on your weak points.
Get Graded — Free Assessment